Definitions of Poverty
Introduction
Poverty is often defined with reference to a specific measure that identifies individuals, families or families or households as being ‘in poverty’. As well as identifying specific populations as being ‘in poverty’, measures are also essential for measuring differences between groups across time and place, the relationships between poverty and health outcomes and the impact of policies and interventions to address poverty.
The most frequently used measures of poverty are income related measures. Income is a valuable measure because (1) it has an obvious and intuitive relationship to poverty, (2) because it can be easily related to other factors influencing health and wellbeing (e.g. costs of basic goods) in relation to poverty (3) data is often collected at an individual level and (4) it is widely used, in particular by policymakers. However, there are also limitations to using income data, including a lack of accounting for different levels of wealth, lack of sensitivity to changes in prices (e.g. during inflation) and differential impacts of low income in different times and places and for different groups.
Key issues in measuring poverty include:
- Whether to take an absolute or relative measure
- Whether to measure before housing costs (BHC) or after housing costs (AHC)
This document sets out a range of measures that have been used to measure poverty and links them to data sources and policies where these details are available.
Approaches to measuring poverty
A number of different public and third sector organisations have set out their approaches to measuring poverty.
The UK government (for which the DWP takes the lead) explicitly refers to measures of ‘low income’ rather than poverty.
Child Poverty Action Group provides a simple framework for deciding how best to measure income/poverty depends based on what the point of measuring poverty is, with desirable features including being able to:
- Reflect expectations of what constitutes a basic standard of living at that point in time;
- Be comparable over time;
- Examine the extent and depth of poverty;
- Examine regional, national and international differences;
- Hold the government to account.
CPAG also make the case for using relative rather than absolute measures:
“At CPAG, we use a relative child poverty measure. We believe that this should be the primary child poverty measure used by government, and other key institutions. A relative poverty measure delivers on most of the features outlined above:
- It reflects what constitutes a basic standard of living at a given point in time, by tracking how well people are doing financially, compared to other people in their society now.
- A relative income measure is quick to update (and project going forward), and changes over time can be easily interpreted.
- The UK government, the European Union, and many other countries use 60 per cent of median income as their poverty threshold, which means it is to some extent internationally comparable.
- The relative poverty measure has broad based support from a wide range of audiences including academic researchers, local authorities, children’s organisations and frontline services
- It better reflects the resources available to the government - if median income is growing it is likely that tax revenues are rising”
The Social Metrics Commission also sets out a framework for their approach to measurement: (2020 report, Box 1, p18)
- Focus on poverty: The Commission’s focus is on measuring poverty, not social mobility, income inequality or wider measures of economic wellbeing. The poverty metric will also draw a clear distinction between indicators of poverty itself, the experience of poverty and risk factors or drivers of future poverty.
- Poverty now: The Commission is assessing the extent to which families have the resources currently available to meet their immediate needs, rather than how they might manage in the future.
- With reference to society: Needs are determined with reference to all of society. The definition of needs will be related to the degree to which people can engage in a life regarded as the ‘norm’ in UK society.
- Neutrality: For the purpose of measurement, the Commission will only consider families’ experience now, and not consider how they got into the situation.
- Lived experience: It is important to understand more than just who is classed as being in poverty. Understanding the nature of that poverty (e.g. poverty depth and persistence) and the wider characteristics and factors that impact on a family’s experience of poverty are also important.
- Ongoing measurement: Commissioners wanted to create a measure that could be captured using available data (or with improvements to existing data) and updated regularly.
- Balancing accuracy with simplicity: The goal is to measure the size, distribution and nature of the population that is in poverty. We will not add unnecessary layers of complexity to capture very small numbers of atypical families.
The 2018 report also describes different methods used around the world (p16)
- A number of countries and organisations (OECD/EU) focus on assessing absolute and/or relative low income as a measure of poverty
- The USA uses an absolute poverty approach that is based on assessments of family’s needs developed in 1963/64 and updated annually for inflation. As a result, this measure establishes a lower threshold for poverty than most European countries. More recently, the USA has introduced a supplementary measure, that considers a wider range of needs and is pegged to spending between the 33rd and 36th consumption percentile
- Some measures are based on qualitative and quantitative research to develop a consensual measure, that seeks to understand what the public believe is a minimum standard at which people should live. For example, in the UK, such measures include those created by the Poverty and Social Exclusion project and the Joseph Rowntree Foundation’s Minimum Income Standard (which measures public views of acceptable living standards rather than poverty directly)
- A wide range of multidimensional measures also exist. These include measures that track a set of indicators, including the UN’s Millennium Development Goals and Sustainable Development Goals, and previous and current UK measures including for Life Chances and the Opportunity for All indicators. Others bring together a range of measurement domains to create a single index, a key example is the approach developed by the Oxford Poverty and Human Development Initiative
Figure 1: Social Metrics Commission approach to measuring poverty (2018)
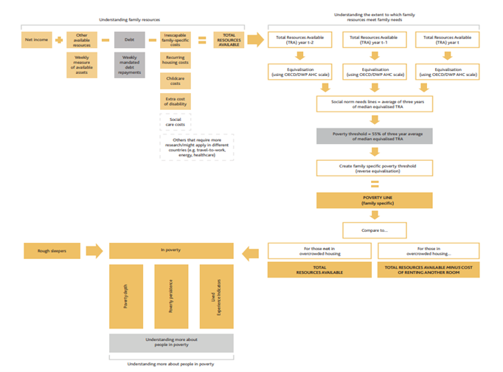
Figure 2: Types of poverty
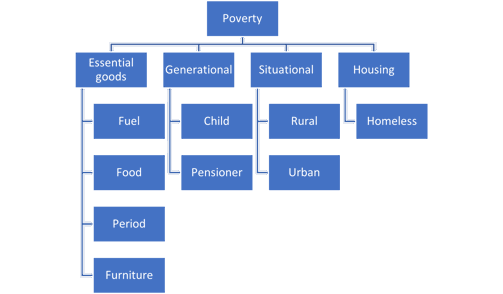
Paul Roderick has collated some further specific measures for the group, based on different categories of poverty defined by: ability to access and afford basic goods for healthy living, by location, and by generation. The figure below illustrates different categories of poverty defined by: ability to access and afford basic goods for healthy living, by location, and by generation.
Other sub-types of poverty may also be fitted into this scheme.
Measures
|
Measure |
Details |
Issues |
Data |
Policy links |
|
Income based measures |
||||
|
Absolute low income
|
Typically those individuals, families or households below specified income threshold anchored at a historical point in time Defined by House of Commons Library briefing on Poverty in the UK as: where an individual does not have the financial means to obtain commodities to sustain life. |
Does not account for wealth/assets Need to ensure clarity about whether income is before or after specific costs (esp housing) |
UK Govt summary figures for children more detailed statistics on the DWP Stat-Xplore tool
|
Child Poverty Act, 2010 defined this as the number of children in households with income less than the poverty line (60% of the UK median) for 2010-11 (adjusted year on year for inflation). Statutory commitment in that act was to reduce to 5% across the UK The Welfare Reform and Work Act 2016 (which superseded the 2010 Act) defined this measure as the percentage of children in the UK who live in households whose equivalised net income for the relevant financial year is less than 60% of median equivalised net household income for the financial year beginning 1 April 2010, adjusted to take account of changes in the value of money since that financial year |
|
Relative low income |
Typically those individuals, families or households below specified income threshold at a current point in time Defined by House of Commons Library briefing on Poverty in the UK as: the standard of living compared to economic standards of living within the same surroundings Households below average income (HBAI) statistics are provided by the DWP: these provide a range of measures and analysis about variation in income between different households in the UK. HBAI stats report households at 50% and 70% of the median income as well as the 60% typically used to measure relative poverty |
Does not account for wealth/assets Need to ensure clarity about whether income is before or after specific costs (esp housing) |
UK Govt summary figures for children
more detailed statistics on the DWP Stat-Xplore tool
HBAI data is also provided through the DWP Stat-Xplore tool. Data is based on the Family Resources Survey (FRS).
The basis for HBAI income calculations is net equivalised disposable household income A detailed user guide (including detailed definitions) for HBAI is available here and the most recent (March 2023) report is here.
Note these measures draw on the same survey data described in the section on Material Deprivation below.
|
Child Poverty Act, 2010 defined this as the number of children living in households with income less than 60% of the median UK income (in the year in question). Statutory commitment in that act was to reduce to 10% across the UK The Welfare Reform and Work Act 2016 (which superseded the 2010 Act) defined this measure as the percentage of children who (a) live in households whose equivalised net income for the relevant financial year is less than 60% of median equivalised net household income for that financial year (b) live in households whose equivalised net income for the relevant financial year is less than 70% of median equivalised net household income for that financial year, and who experience material deprivation Equivilisation is based on household size and composition The Social Metrics Commission proposed a relative poverty threshold of 55% of the three-year smoothed median total resources available (TRA) measure. TRA captures assets debts and household costs such as housing, disability, and childcare. DWP had indicated they would develop a new poverty measure based on the Social Metrics Commission work, then suspended this work, but in March 2023 announced work would resume The JRF set out a relative measure of ‘deep poverty’ in their 2022 report ‘Going without: deepening poverty in the UK’ defined as below 40% median equivalised income after housing costs |
|
Combined low income and material deprivation |
Children in households with an income below 70% of the contemporary UK median household income and with a material deprivation score of 25 or more (measured by a lack of adult and child goods and services). |
Measure created as statutory commitment |
Data believed no longer to be gathered. |
Child Poverty Act, 2010 included reducing this measure to 5% as a statutory commitment. |
|
Persistent Poverty |
Children in households with an income less than 60% of the UK median household income (before housing costs) in at least three years out of four. |
Measure initially created as statutory commitment under 2010 Act, stat commitment amended to reflect 2016 Act
|
Data now reported annually by DWP in Income Dynamics report to meet stat commitment, most recent report March 2023 Based on Understanding Society (USoc), a longitudinal survey run by the University of Essex, which follows sampled individuals over time. It has a two-year survey period (“wave”) based upon calendar years, with individuals interviewed once a year. The most recent wave is Wave 12, covering the calendar years 2020 and 2021. The Wave 12 longitudinal sample included approximately 28,000 individuals Measures both BHC and AHC |
Child Poverty Act, 2010 included reducing this measure to 7% as a statutory commitment. Data believed no longer to be gathered The Welfare Reform and Work Act 2016 (which superseded the 2010 Act) defined this measure as the percentage of children who live in households whose equivalised net income has been less than 60% of median equivalised net household income in at least 3 of the last 4 survey periods Equivilisation is based on household size and composition |
|
Deprivation based measures |
||||
|
Material deprivation |
Whether people can afford certain goods, services or activities that are considered to be essential. Measures of material deprivation will be informed by survey and qualitative research with people to gain their views on what is considered essential. |
|
Department for Work and Pensions (DWP) use the Family Resources Survey (FRS) to publish statistics about children, working-age people and pensioners in material deprivation in their Households Below Average Income report (DWP), broken down for UK countries and regions of England |
|
|
Destitution |
Lack of access to essentials (shelter, food, heating, lighting, clothing and footwear, and basic toiletries) OR extremely low or no income People are destitute if: EITHER: (a) They have lacked two or more of the following six essential items over the past month, because they cannot afford them: i. shelter (they have slept rough for one or more nights) ii. food (they have had fewer than two meals a day for two or more days) iii. heating their home (they have been unable to heat their home for five or more days) iv. lighting their home (they have been unable to light their home for five or more days) v. clothing and footwear (appropriate for the weather) vi. basic toiletries (such as soap, shampoo, toothpaste and a toothbrush). OR: (b) Their income is so extremely low that they are unable to purchase these essentials for themselves. the relevant weekly ‘extremely low income thresholds by averaging: the actual spend on these essentials by the poorest 10% of the population; 80% of the JRF ‘Minimum Income Standard’ costs for equivalent items; and the amount that the general public thought of as required for a household of the their size to avoid destitution, in an omnibus survey we undertook as part of the original study. |
Developed by collating surveys |
JRF in 2020 estimated the numbers experiencing destitution, figures not routinely publishing |
|
|
Household deprivation |
The ONS used data from the 2021 census to classify households by the number of deprivation indicators they reported. Four household characteristics were included: Education A household is classified as deprived in the education dimension if no one has at least level 2 education and no one aged 16 to 18 years is a full-time student. Employment A household is classified as deprived in the employment dimension if any member, not a full-time student, is either unemployed or economically inactive due to long-term sickness or disability. Health A household is classified as deprived in the health dimension if any person in the household has general health that is bad or very bad or is identified as disabled. Housing A household is classified as deprived in the housing dimension if the household's accommodation is either overcrowded, in a shared dwelling, or has no central heating. |
|
Published as the proportion of families reporting 0-4 dimensions of deprivation at an Output Area level, also aggregated to local authority. |
|
|
Indices of deprivation |
Multifaceted area level measures of deprivation by LSOA. Data is ranked based on a number of sources; income-based domain can be disaggregated The income domain includes one measure; the proportion of the population in receipt of any of the following benefits: (a) Income-Related Benefit claimants (b) Tax Credit recipients (c) Supported Asylum Seekers (d) People on Universal Credit (excluding those “working with no requirements”) (more complete details are available here) |
Income element is based around employment and receipt of benefits |
|
|
|
Domain specific measures |
||||
|
Fuel |
In England the Government introduced a new definition of fuel poverty in 2021. This is the ‘Low Income Low Energy Efficiency’ (LILEE) definition of fuel poverty. Here a household is fuel poor if: · They are living in a property with an energy efficiency rating of band D, E, F or G18 · their disposable income (income after housing costs and energy needs) would be below the poverty line. The Fuel Poverty (Targets, Definition and Strategy) (Scotland) Act 2019 introduced a new definition of fuel poverty in Scotland. Under the new two-part definition, a household is considered fuel poor if: · after housing costs have been deducted, more than 10% (20% for extreme fuel poverty) of their net income is required to pay for their reasonable fuel needs and; · after further adjustments are made to deduct childcare costs and any benefits received for a disability or care need, their remaining income is insufficient to maintain an acceptable standard of living, defined as being at least 90% of the UK Minimum Income Standard (MIS). The Welsh Government defines a household as being in fuel poverty if: they would have to spend more than 10 per cent of their income on maintaining a satisfactory heating regime |
|
|
|
|
Food |
No measures known (although the Trussell Trust publishes statistics of food bank use which may be relevant) Varying definitions have been proposed which may be amenable to measurement: ‘The inability to afford, or to have access to, food to make up a healthy diet.’ ‘Food poverty is worse diet, worse access, worse health, higher percentage of income on food and less choice from a restricted range of foods.’ The inability to consume an adequate quality or sufficient quantity of food in socially acceptable ways, or the uncertainty that one will be able to do so Professor Elizabeth Dowler |
|
|
|
